 VUE框架中应用
# VUE框架中应用
# 第一步:主页面引用组件库或者视图导入es类型的组件库文件
- 方式一:在应用的主页面index.html中引入组件库文件,所有视图均可使用
<script src="static/libs/graphvis.min.js"></script>
- 方式二:在vue视图中导入支持es模式的组件库文件
import GraphVis from '@/assets/graphvis.esm.min.js';
# 第二步:界面中定义可视化区域包裹层元素
- 页面定义一个画布包裹层元素,需要指定宽、高样式属性
<div id="graph-container" style="width:100%;height:500px;"></div>
# 第三步:在data上定义实例化对象 GraphVis,并在mounted中初始化对象
export default {
    data() {
        return {
            graphVis: null //GraphVis实例对象
        }
    },
    methods: {
        createGraph() {
            this.graphVis = new GraphVis({
                container:document.getElementById('graph-container'), //画布层
                licenseKey:'licensekey' //授权license
                config:config  //全局配置
            });
        }
    },
    mounted() {
        this.createGraph();//初始化客户端
    }
}
1
2
3
4
5
6
7
8
9
10
11
12
13
14
15
16
17
18
19
20
2
3
4
5
6
7
8
9
10
11
12
13
14
15
16
17
18
19
20
# 第四步:根据业务需要注册交互事件,分类配置,右键菜单等
reconfig(){ //可视化配置注册
    //配置节点类型显示样式(支持大小,颜色,形状,图片的统一配置)
    this.graphVis.reConfigNodeCluster({
        'Company':{shape: 'circle',size: 48,color:'120,220,140',image:this.imageCache.org},
        'Person': {shape: 'circle',size: 40,color:'155,155,225',image:this.imageCache.people},
        'boss':{shape: 'circle',size: 44,color:'125,155,225', image:this.imageCache.boss}
    });
    //统一配置连线类型的显示样式(支持类型,粗细,颜色,虚线样式)
    this.graphVis.reConfigLinkCluster({
        'INVEST':{lineWidth: 1,color:'185,185,185',lineDash:[0]},
        'EMPLOY':{lineWidth: 2,color:'130,180,220'},
        'relate':{lineWidth: 1,color:'120,200,120',lineDash:[8,3,8]},
    });
}

registElementEvent(){ //注册元素的交互事件
    var that = this;
    //节点的双击事件
    that.graphVis.registEventListener('node','dblClick',function(event,node){
        that.findRelation(node);
    });
    //连线的单击事件
    that.graphVis.registEventListener('link','click',function(event,link){
        that.graphVis.addToSelectedElements([link.source,link.target]);
    });
}

registElementEvent(){ //注册节点右键菜单
    var that = this;
    //节点的双击事件
    that.graphVis.registRightMenu('node',{
        show : function(e,graphvis,node){
            //控制菜单显示
        },
        hide : function(){
            //控制菜单隐藏
        }
    });
}
1
2
3
4
5
6
7
8
9
10
11
12
13
14
15
16
17
18
19
20
21
22
23
24
25
26
27
28
29
30
31
32
33
34
35
36
37
38
39
40
2
3
4
5
6
7
8
9
10
11
12
13
14
15
16
17
18
19
20
21
22
23
24
25
26
27
28
29
30
31
32
33
34
35
36
37
38
39
40
# 第五步:调用组件库提供的接口进行数据添加和交互处理
//从服务端获取图数据,包含nodes和links两组数据,
var graphData = {
	nodes:[{id:1000,label:'节点一',type:'Company'},{id:2000,label:'节点二',type:'Boss'}],
	links:[{id:'e1',source:1000,target:2000,label:'关系',type:'EMPLOY'}]
};

// 添加图数据
graphVis.addGraph(graphData);

// 对图进行快速网络布局
graphVis.excuteLocalLayout('fastForce',null, function () {
    graphVis.zoomFit(); //布局结束后居中显示
});
1
2
3
4
5
6
7
8
9
10
11
12
13
14
2
3
4
5
6
7
8
9
10
11
12
13
14
# VUE页面应用实例
<template>
<div style="height: 100%;">
    <div class="graph-nav">
      <div style="float:left;">GraphVis知识图谱可视化应用平台</div>
    </div>
    <!--图显示区域-->
    <div class="graph-area" style="height: calc(100% - 40px);">

      <!-- 绘图面板区域 -->
      <div id="graph-container" style="width: 100%;height:100%;"></div>
    </div>
</div>
</template>

<script>
import { config } from '@/assets/defaultConfig.js';
import { getLayoutDefaultConfig,getLayoutParams } from '@/assets/layoutParamsDict.js';
import { searchData } from '@/assets/demo3.js';

export default {
    data() {
        return {
            graphVis: null //GraphVis实例对象
        }
    },
    methods: {
        createGraph() {
            this.graphVis = new GraphVis({
                container:document.getElementById('graph-container'), //画布层
                licenseKey:'licensekey' //授权license
                config:config  //全局配置
            });

            this.reconfig();
            this.registElementEvent();
        },
        // 初始化图谱数据
        initGraphData() {
            var graphData = searchData({id:'67299081'}); //按条件查询服务端关系数据
            this.graphVis.addGraph(graphData); //添加图数据

            this.runLayout('fastForce',true); //对于没有坐标的情况,需要调用布局算法调整数据
        },
        reconfig(){ //可视化配置注册
            //配置节点类型显示样式(支持大小,颜色,形状,图片的统一配置)
            this.graphVis.reConfigNodeCluster({
                'Company':{shape: 'circle',size: 48,color:'120,220,140',image:this.imageCache.org},
                'Person': {shape: 'circle',size: 40,color:'155,155,225',image:this.imageCache.people},
                'boss':{shape: 'circle',size: 44,color:'125,155,225', image:this.imageCache.boss}
            });

            //统一配置连线类型的显示样式(支持类型,粗细,颜色,虚线样式)
            this.graphVis.reConfigLinkCluster({
                'INVEST':{lineWidth: 1,color:'185,185,185',lineDash:[0]},
                'EMPLOY':{lineWidth: 2,color:'130,180,220'},
                'relate':{lineWidth: 1,color:'120,200,120',lineDash:[8,3,8]},
            });
        },
        registElementEvent(){ //注册元素的交互事件
            var that = this;

            //节点的双击事件
            that.graphVis.registEventListener('node','dblClick',function(event,node){
                that.findRelation(node);
            });

            //连线的单击事件
            that.graphVis.registEventListener('link','click',function(event,link){
                that.graphVis.addToSelectedElements([link.source,link.target]);
            });
        },
        runLayout(layoutType,isInit){
            var that = this;
            let layoutConfig = getLayoutDefaultConfig(layoutType);
            if(isInit || that.graphVis.nodes.length > 200){ //异步布局
                var graphData = {nodes:that.graphVis.nodes,links:that.graphVis.links};
                that.graphVis.excuteWorkerLayout(graphData,layoutType,layoutConfig, false, function () {
                    that.endLayoutCallback();
                });
            }else{
                //同步布局(带动画,性能低)
                that.graphVis.excuteLocalLayout(layoutType, layoutConfig, function () {
                    that.endLayoutCallback();
                });
            }
        },
        findRelation(node){ //扩展关系
            if(node.isTrusted){
                node = this.currentNode;
            }
            var relationData = searchData(node); //从服务端查询数据后,设置动态添加
            this.graphVis.activeAddData(node,relationData,'fastForce'); //动态追加节点扩展数据
        }
    },
    created() {

    },
    mounted() {
        this.createGraph();//初始化客户端
    },
    destroyed() {
        if(this.graphVis){
            this.graphVis.destory(); //销毁组件客户端,释放内存
        }
    }
}

</script>
1
2
3
4
5
6
7
8
9
10
11
12
13
14
15
16
17
18
19
20
21
22
23
24
25
26
27
28
29
30
31
32
33
34
35
36
37
38
39
40
41
42
43
44
45
46
47
48
49
50
51
52
53
54
55
56
57
58
59
60
61
62
63
64
65
66
67
68
69
70
71
72
73
74
75
76
77
78
79
80
81
82
83
84
85
86
87
88
89
90
91
92
93
94
95
96
97
98
99
100
101
102
103
104
105
106
107
108
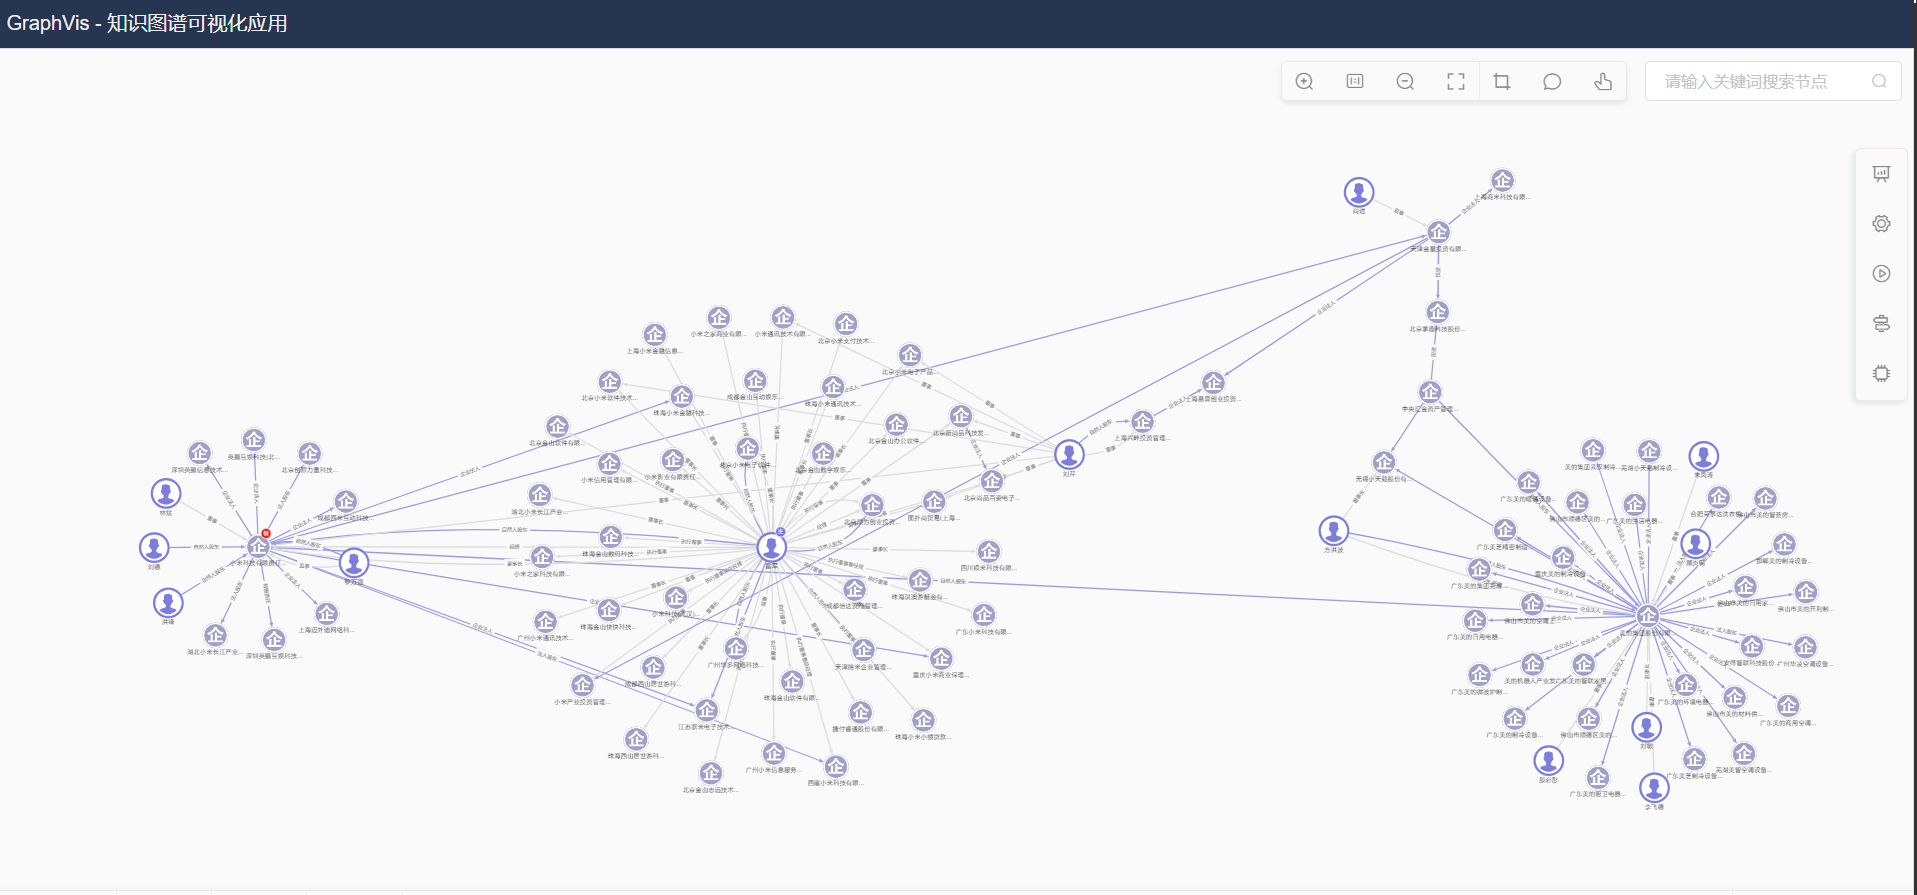
# 应用示例系统截图